GRAFANA
Nodeum leverages powerful monitoring tools like Grafana and Prometheus to continuously collect detailed performance data across your entire cluster. This gives you a clear, real-time view of the health and status of every node, along with a rich set of metrics for system resource utilization—such as CPU, memory, storage, and network usage. With these insights at your fingertips, you can quickly detect issues, optimize performance, and ensure your environment runs reliably and efficiently.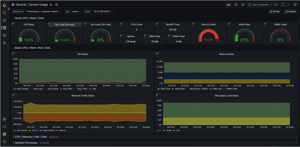
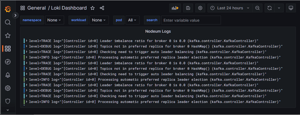
GRAFANA LOKI
Centralize all your logs in one place by exporting them to a Grafana Loki platform. This gives you a unified, searchable view of your system activity, making it easier to monitor performance, troubleshoot issues, and improve reliability.
Nodeum delivers real-time performance dashboards, historical trend analysis, and proactive alerts that surface potential issues before they impact operations.